Influence and the Food Pyramid

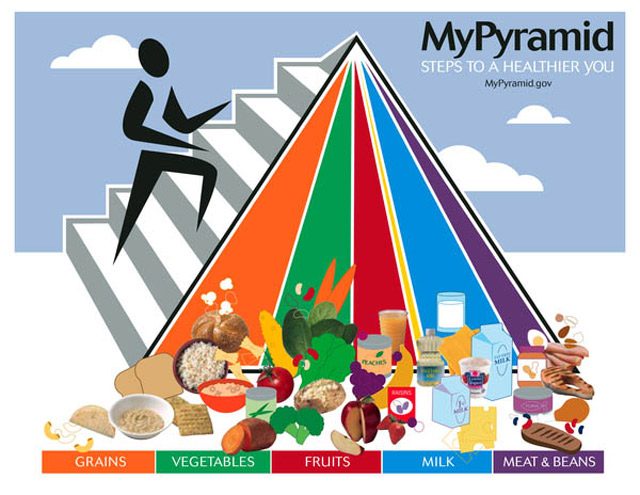
  • The USDA's food pyramid. (Photo courtesy of the USDA)

The USDA food pyramid shows the amounts and kinds of foods that are healthy to eat. But the food pyramid is not simply about eating right. Money and politics play a big role in this symbol. Kyle Norris takes a look:

Transcript

The USDA food pyramid shows the amounts and kinds
of foods that are healthy to eat. But the food pyramid is
not simply about eating right. Money and politics play a
big role in this symbol. Kyle Norris takes a look:


You’ve heard of the food pyramid, right?


“I can see the picture of the food pyramid… I think it’s how much of each type of food you’re
supposed to eat.”


“The food pyramid is like non-existent
in my day-to-day reality.”


“Yeah, I didn’t really understand what the point of the food pyramid was.”


The pyramid is a visual tool that the United States
Department of Agriculture created in the 1990s to help
people know what to eat. The USDA has advised
people about nutrition for a long time.


Throughout the past century, nutritional advice was
generally a message to eat more food and a wider
variety of food, and eventually people did eat more
food… too much food. And overeating and chronic
diseases became a problem.


In the late 1960s and early 70s, the
message about nutrition changed. The government said
scale back. Eat less. And this caused an uproar, and it
still does:

“Food companies are upset about it because they don’t
want the government telling people to eat less of the
products they manufacture.”


That’s Marion Nestle. She’s a professor of Nutrition,
Food Studies, and Public Health at New York
University. She also wrote the book “Food Politics:”


“This is health conflicting with business interests
basically, and since food companies, among other
corporations, fund election campaigns, elected leaders
need to listen to them. And since elected leaders control
what goes on in federal agencies, federal agencies need
to listen to elected leaders. That’s how our political
system works.”


Here’s what happens from that trickle down effect:
Corporations influence the food pyramid. So, the
pyramid’s wording of what and how much you should
eat gets watered-down and un-specific, so as not to
offend the food companies.


Here’s Nestle again:


“We don’t have an independent voice in the government
advising the public about diet and health because
if the government were to advise the public
about diet and health, it would have to tell people to eat
less junk food. And it can’t do that… Because the companies
that produce the junk food wouldn’t stand for it.”


It’s not only junk food companies that freak out about
what the government says you should eat. The meat
industry threw a fit when the pyramid was going to be
released in 1991.


The pyramid said those awful, hurtful words about
meat: “Eat less.”


So the USDA yanked the pyramid, tweaked it ever so
slightly, and re-released it the next year. The food
industry made a lot of squawk about the pyramid. You
have to wonder what kind of pressure that had on the
USDA.


Jackie Haven is a USDA nutritionist:


“I really, there’s really nothing I have to say on that
issue. I don’t feel we had pressure from anybody and…
Can we move to something else?


Okay, so, she wouldn’t say much.


But you have to wonder if the USDA had a conflict of
interest here. Their key job is to promote agriculture in
the marketplace. And yet they tell us what we should eat.


Marion Nestle says the USDA does have a conflict of
interest:


“Its main function
is to sell more products not less. It’s the fox guarding
the chicken… certainly not the place
where you have independent advice about what to eat.


The USDA created the new “mypyramid.gov” in 2005.
They’ve dubbed it an “interactive food guidance
system.” About the only way you can get to it is online.


You punch in your age, weight, and height. You also
type in how physically active you are each day. Then it
spits out a personalized plan.


My My Pyramid plan said that every day I should eat about 7
ounces of grains, 3 cups veggies, 2 cups fruit, 3 cups of
milk, and 6 ounces of meat and beans. I don’t know
how to translate that information. I mean, I don’t really measure my
apples in cups. And three cups of milk?


The new My Pyramid’s wording is delicate. It says things like “Most meat and poultry choices
should be lean or lowfat.” “Include” this,
“Choose” that. Not very specific suggestions.


Marion Nestle says there’s no evidence that the public
understands the original pyramid. She says even fewer
people understand the new My Pyramid. The food
pyramid has always been controversial. Its stated
purpose is to help us eat healthier.


The political reality is that pressure from the food
industry makes it very difficult for the pyramid to clearly say
what is really best for our health.


For the Environment Report, I’m Kyle Norris.

Related Links

Growing Zones Warm Up

  • The National Arbor Day Foundation's revised hardiness zone map. (Photo courtesy of the National Arbor Day Foundation)

If you’ve been thinking about landscaping your yard, you should know things have
changed. The climate is warming so quickly that one organization has changed the
plant hardiness zone map. That’s the little map you sometimes see on the back of
seed packets. Lester Graham reports… you might want to check out the new map
before you spend hundreds of dollars on a tree that might not live long in your
warmer zone:

Transcript

If you’ve been thinking about landscaping your yard, you should know things have
changed. The climate is warming so quickly that one organization has changed the
plant hardiness zone map. That’s the little map you sometimes see on the back of
seed packets. Lester Graham reports… you might want to check out the new map
before you spend hundreds of dollars on a tree that might not live long in your
warmer zone:


You know, I’ve talked to a lot of gardeners and homeowners who do their own
landscaping about this plant hardiness zone map change, and at first they’re
kind of astounded. The growing zones are changing? Because it’s getting warmer?


But then, they sort of pause and think for a moment… and usually say something like,
“That makes sense.”


The United States Department of Agriculture issues the plant hardiness zone map.
It’s basically a map of the annual average low temperatures that helps folks figure
out what they can plant and expect to survive. But the USDA hasn’t updated its map
since 1990.


The spokesman at the National Arbor Day Foundation, Woody Nelson – I kid you not,
the Arbor Day guy’s name is Woody – Woody says his organization issued a new
map because it really needed to be updated:


“You know, people were asking us to help out, you know, ‘This old USDA map just doesn’t
seem to work for us anymore. I don’t think it’s accurate. What can you do to help?’
So we took it upon ourselves to give tree-planters the most up-to-date information
that we could.”


So the National Arbor Day Foundation looked at the low temperature data gathered
by the National Oceanic and Atmospheric Administration since 1990, and the people
were right: things are warming up:


“And over that 15-year span that we used, much of the country had warmed a full
hardiness zone.”


And there’s a ten degree difference from one zone to the next. It shows a real on-
the-ground trend.


Richard Andres is with Tantre Farm. They grow organic produce for farmers’
markets like this one in Michigan. Andres didn’t know about the new Arbor Day
Hardiness Zone map, but it makes sense to him. He says he’s seeing more
extremes:


“You know, last winter was unusually warm. The winter before, unusually warm.
So, we really didn’t even get a decent freeze. We had a huge amount of bugs the
following spring. So we are noticing more extremes.”


But a farmer or gardener can adjust things for annual plants. Long term, you’re
probably wondering whether you can now plant that dogwood or whether you
should plant that spruce from up north.


(Sound of sprinkler)


Phil Walsh sells a lot of trees at Lodi Farms nursery. He knew about the new Arbor
Day Hardiness Zone map. But, he says there’s a lot more to think about than just
the annual average low temperature when you’re thinking about planting:


“Cold is not the only, or really the most, important factor when determining plant
hardiness. Questions like soil: is it well-drained; is it not; is it wet; is it dry; is it acid
or is it alkaline; do you have wind; do you have shade? Questions like this: is it high
in organic material or low in organic material? These tend to have more impact on
whether or not plants survive than strictly the zone rating.”


Walsh says the trees are pretty tough, and most of them can adapt:


“Yes, things have warmed up over the last 15 years and they may well continue or it may change and it may go down. Pick a good, hardy plant that’s well-suited for your soil
and typically one that’s native here, that’s gone through these temperature changes
in the past and I don’t expect anybody’s going to have any problems with them.”


That’s not to say that every kind of tree is taking this in stride. For example, black
spruce trees adapted to Canadian and upper New England cold might not be such a
good choice as far south as it’s been grown in the past.


Woody Nelson at the National Arbor Day Foundation says trees native to the North
are starting to be affected by the warming climate:


“There’s a whole lot of white pines that have been planted in Georgia, in the South
as a nice landscape tree over the years. And now those white pines are coming
under a little bit of stress. The native lodge pole pines, the native loblolly pines in the
deep South, again native species are something that we want to promote and stick
with.”


So, the basic rule is: if the plant hardiness zone map has shifted one growing zone
warmer in just 15 years, you’ll probably want to stick to trees native to your area, or
from just a little south of you just in case this warming trend sticks around for a while.


For the Environment Report, this is Lester Graham.

Related Links